Venetian Cartography: Difference between revisions
No edit summary |
No edit summary |
||
| (One intermediate revision by the same user not shown) | |||
| Line 14: | Line 14: | ||
Without the modern technology and mathematical principles used in cartography today, the earliest maps served merely as descriptions of simple geographic features, or an artistic or symbolic role in society. The birth of cartography as a discipline is often attributed to Ptolemy, a Greco-Roman mathematician, astronomer, geographer, and, of course, cartographer. Scholars and historians consider him the first to take mapmaking and turn it from an artistic endeavor into a systematic and scientific practice, transforming maps from mere pictures of the land into models of space based on actual measurements and mathematics. Ptolemy’s most influential work, Geographia, from 150 AD, compiled information of Greco-Roman geographical knowledge. It included instructions on how to create a grid using longitude and latitude, making him the first to establish a coordinate system for use in cartography. It addressed a key problem of the time in creating accurate maps of the world; how to project a three-dimensional scene onto a two-dimensional plane. He created one of the first solutions to this problem through his perspective projections, a solution that is still used in cartography today. Ptolemy’s Geographia would continue to influence mapmaking for hundreds of years, revisited many times during the Age of Exploration and the Renaissance as the world seemed to grow in the eyes of Europe. | Without the modern technology and mathematical principles used in cartography today, the earliest maps served merely as descriptions of simple geographic features, or an artistic or symbolic role in society. The birth of cartography as a discipline is often attributed to Ptolemy, a Greco-Roman mathematician, astronomer, geographer, and, of course, cartographer. Scholars and historians consider him the first to take mapmaking and turn it from an artistic endeavor into a systematic and scientific practice, transforming maps from mere pictures of the land into models of space based on actual measurements and mathematics. Ptolemy’s most influential work, Geographia, from 150 AD, compiled information of Greco-Roman geographical knowledge. It included instructions on how to create a grid using longitude and latitude, making him the first to establish a coordinate system for use in cartography. It addressed a key problem of the time in creating accurate maps of the world; how to project a three-dimensional scene onto a two-dimensional plane. He created one of the first solutions to this problem through his perspective projections, a solution that is still used in cartography today. Ptolemy’s Geographia would continue to influence mapmaking for hundreds of years, revisited many times during the Age of Exploration and the Renaissance as the world seemed to grow in the eyes of Europe. | ||
== | ===Social Theory of Maps=== | ||
== | Maps can communicate far more than geographical relationships; they reveal insights into the society, culture, and politics of a given place and era. This is especially true for Venice, where historical maps provide a rich record of the city's social, political, and economic life. Understanding these aspects can guide the effective presentation of Venice’s map collection, helping viewers engage with the information and context behind the maps rather than seeing them solely as artifacts. The information the maps display can be considered more important than the maps themselves. For example; Venetian maps can reveal the locations of religious institutions and urban infrastructure providing insight into Venice’s economic and social organizations. The maps can further inform the viewer about how Venice used to be in ways we otherwise couldn’t know, such as viewing where now demolished churches would have been and potentially what they may have looked like. | ||
Building on the understanding that maps convey social, cultural, and political information, the ways we access, analyze, and share maps have been transformed by the digital age. In Venice, tools like the Venice Project Center’s “Venetian Historical Map Explorer” exemplify this transformation; users can explore interactive layers highlighting specific features—such as churches, canals, bridges, islands, and belltowers—and access linked content providing historical context. These digital tools preserve the historical artifacts while emphasizing the information they convey, extending the principles of social cartography into a modern, interactive format. | |||
=== | ===Maps In Digital Age=== | ||
The rise of digital technology in the late 20th century transformed cartography from a manual craft into a data-driven scientific discipline. Early computers made it possible to store, process, and analyze large geographic datasets, shifting maps from static visual products to dynamic analytical tools. In the 1950s and 1960s, researchers began using computers to process geographic and census information, leading to the development of early digital mapping methods. A major milestone occurred in 1963 with the creation of the Canada Geographic Information System (CGIS) by Roger Tomlinson, widely regarded as the first true geographic information system (GIS). Around the same time, the Harvard Laboratory for Computer Graphics and Spatial Analysis pioneered software such as SYMAP, GRID, and ODYSSEY, which advanced thematic mapping, spatial modeling, and urban and environmental planning. Parallel developments in satellite technology expanded the possibilities of digital cartography. Multispectral images produced by early satellite programs allowed researchers to monitor global land cover, vegetation, and natural resources, while also supporting meteorology and military intelligence. By the mid-1990s, the introduction of global positioning systems (GPS) further transformed mapping into a real-time, continuously updating process. The launch of accessible tools like Google Maps in 2005 made digital geographic information widely available to the public. | |||
These technological innovations have reshaped how historical maps are preserved and interpreted. For a city like Venice—where maps form a key part of cultural identity and collective memory—digitization offers opportunities for broader access but also raises challenges. Without standardized methods for scanning, organizing, and contextualizing historical documents, important social and historical information may be lost. Contemporary digital projects work to address these issues by developing consistent workflows and research frameworks that safeguard Venice’s cartographic heritage for the future. | |||
==Map Types== | |||
Venetian maps come in many forms, each offering a different way of understanding the city. Some emphasize navigation, others administration, and others visual storytelling. Together, they reveal how Venice was seen from above, from the side, and from imagined perspectives. | |||
===Bird's Eye=== | |||
Bird’s-eye maps present Venice as if viewed from above at an angle. These maps combine geographic accuracy with artistic detail, showing buildings, canals, and landmarks in a way that feels immersive and recognizable. They helped viewers understand the city as a whole and emphasized Venice’s grandeur and complexity. | |||
<center>[[File:birds-eye-view-of-venice.jpg|500px]]</center> | |||
===Isometric=== | ===Isometric=== | ||
Isometric maps offer a balanced view that preserves scale while showing depth and structure. Buildings remain upright and proportional, making these maps especially effective for understanding urban form. In Venetian cartography, isometric views helped bridge the gap between technical mapping and visual storytelling. | |||
<center>[[File:Jacopo-de-Barbari-Venetie.jpg|850px]]</center> | |||
== | ===Orthographic=== | ||
Orthographic maps show Venice from a straight-down perspective, focusing on accuracy and scale. These maps were especially useful for administration, planning, and record-keeping. They reflect Venice’s practical approach to cartography and its use of maps as tools for governance. | |||
<center>[[File:Orthographic-venice-map.jpg|840px]]</center> | |||
==See Also== | ==See Also== | ||
*[[Maps]] | *[[Maps]] | ||
Latest revision as of 11:26, 11 December 2025
This page contains information about Venetian Cartography. For information about past and historical Venetian maps, see Maps.
Maps are a critical part to society on a day-to-day basis, in the modern age and dating back throughout history. The baseline use of a map remains the same throughout the test of time, to convey geographical information to the reader. Although, throughout history maps had a much deeper meaning to society than many people realize today. Before the digital age where maps became regularly accessible, maps were used as tools to create realities rather than just display them.
History
Although the practice of mapmaking can be traced back thousands of years, the form and function of the oldest known maps is hard to reconcile with maps of today. One of the oldest known maps is the Mammoth Tusk Map, discovered in Czechia, which is approximately 25,000 years old. It features carvings of rivers, local landscapes, and settlement plans on a piece of Ivory. The oldest known map of the world is the Babylonian Imago Mundi, a clay tablet depicting Babylon and the Euphrates at the world’s center, along with several key Mesopotamian cities all surrounded by an ocean. The Imago Mundi depicts the world as a circle, and dates back ~2,700 years.
-
![Moravian Museum. (c. 25,000 BP). Pavlov Mammoth Tusk Map [mammoth ivory with incised markings]. Anthropos Institute collection, Moravian Museum, Brno, Czech Republic.](/images/thumb/4/4d/A-mammoth-tusk.webp/588px-A-mammoth-tusk.webp.png) Moravian Museum. (c. 25,000 BP). Pavlov Mammoth Tusk Map [mammoth ivory with incised markings]. Anthropos Institute collection, Moravian Museum, Brno, Czech Republic.
Moravian Museum. (c. 25,000 BP). Pavlov Mammoth Tusk Map [mammoth ivory with incised markings]. Anthropos Institute collection, Moravian Museum, Brno, Czech Republic. -
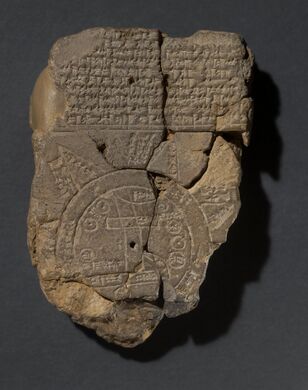 The Babylonian World Map (“Imago Mundi”), clay tablet, c. 6th century BCE. British Museum, London (BM 92687)
![Moravian Museum. (c. 25,000 BP). Pavlov Mammoth Tusk Map [mammoth ivory with incised markings]. Anthropos Institute collection, Moravian Museum, Brno, Czech Republic.](/index.php/File:A-mammoth-tusk.webp)

Without the modern technology and mathematical principles used in cartography today, the earliest maps served merely as descriptions of simple geographic features, or an artistic or symbolic role in society. The birth of cartography as a discipline is often attributed to Ptolemy, a Greco-Roman mathematician, astronomer, geographer, and, of course, cartographer. Scholars and historians consider him the first to take mapmaking and turn it from an artistic endeavor into a systematic and scientific practice, transforming maps from mere pictures of the land into models of space based on actual measurements and mathematics. Ptolemy’s most influential work, Geographia, from 150 AD, compiled information of Greco-Roman geographical knowledge. It included instructions on how to create a grid using longitude and latitude, making him the first to establish a coordinate system for use in cartography. It addressed a key problem of the time in creating accurate maps of the world; how to project a three-dimensional scene onto a two-dimensional plane. He created one of the first solutions to this problem through his perspective projections, a solution that is still used in cartography today. Ptolemy’s Geographia would continue to influence mapmaking for hundreds of years, revisited many times during the Age of Exploration and the Renaissance as the world seemed to grow in the eyes of Europe.
Social Theory of Maps
Maps can communicate far more than geographical relationships; they reveal insights into the society, culture, and politics of a given place and era. This is especially true for Venice, where historical maps provide a rich record of the city's social, political, and economic life. Understanding these aspects can guide the effective presentation of Venice’s map collection, helping viewers engage with the information and context behind the maps rather than seeing them solely as artifacts. The information the maps display can be considered more important than the maps themselves. For example; Venetian maps can reveal the locations of religious institutions and urban infrastructure providing insight into Venice’s economic and social organizations. The maps can further inform the viewer about how Venice used to be in ways we otherwise couldn’t know, such as viewing where now demolished churches would have been and potentially what they may have looked like.
Building on the understanding that maps convey social, cultural, and political information, the ways we access, analyze, and share maps have been transformed by the digital age. In Venice, tools like the Venice Project Center’s “Venetian Historical Map Explorer” exemplify this transformation; users can explore interactive layers highlighting specific features—such as churches, canals, bridges, islands, and belltowers—and access linked content providing historical context. These digital tools preserve the historical artifacts while emphasizing the information they convey, extending the principles of social cartography into a modern, interactive format.
Maps In Digital Age
The rise of digital technology in the late 20th century transformed cartography from a manual craft into a data-driven scientific discipline. Early computers made it possible to store, process, and analyze large geographic datasets, shifting maps from static visual products to dynamic analytical tools. In the 1950s and 1960s, researchers began using computers to process geographic and census information, leading to the development of early digital mapping methods. A major milestone occurred in 1963 with the creation of the Canada Geographic Information System (CGIS) by Roger Tomlinson, widely regarded as the first true geographic information system (GIS). Around the same time, the Harvard Laboratory for Computer Graphics and Spatial Analysis pioneered software such as SYMAP, GRID, and ODYSSEY, which advanced thematic mapping, spatial modeling, and urban and environmental planning. Parallel developments in satellite technology expanded the possibilities of digital cartography. Multispectral images produced by early satellite programs allowed researchers to monitor global land cover, vegetation, and natural resources, while also supporting meteorology and military intelligence. By the mid-1990s, the introduction of global positioning systems (GPS) further transformed mapping into a real-time, continuously updating process. The launch of accessible tools like Google Maps in 2005 made digital geographic information widely available to the public.
These technological innovations have reshaped how historical maps are preserved and interpreted. For a city like Venice—where maps form a key part of cultural identity and collective memory—digitization offers opportunities for broader access but also raises challenges. Without standardized methods for scanning, organizing, and contextualizing historical documents, important social and historical information may be lost. Contemporary digital projects work to address these issues by developing consistent workflows and research frameworks that safeguard Venice’s cartographic heritage for the future.
Map Types
Venetian maps come in many forms, each offering a different way of understanding the city. Some emphasize navigation, others administration, and others visual storytelling. Together, they reveal how Venice was seen from above, from the side, and from imagined perspectives.
Bird's Eye
Bird’s-eye maps present Venice as if viewed from above at an angle. These maps combine geographic accuracy with artistic detail, showing buildings, canals, and landmarks in a way that feels immersive and recognizable. They helped viewers understand the city as a whole and emphasized Venice’s grandeur and complexity.

Isometric
Isometric maps offer a balanced view that preserves scale while showing depth and structure. Buildings remain upright and proportional, making these maps especially effective for understanding urban form. In Venetian cartography, isometric views helped bridge the gap between technical mapping and visual storytelling.

Orthographic
Orthographic maps show Venice from a straight-down perspective, focusing on accuracy and scale. These maps were especially useful for administration, planning, and record-keeping. They reflect Venice’s practical approach to cartography and its use of maps as tools for governance.
