Buildings: Difference between revisions
No edit summary |
|||
| (6 intermediate revisions by the same user not shown) | |||
| Line 1: | Line 1: | ||
<span style="font-family: arial, helvetica, sans-serif; font-size: 18pt;" ><strong data-start="442" data-end="455">Buildings</strong></span> | <span style="font-family: arial, helvetica, sans-serif; font-size: 18pt;"><strong data-start="442" data-end="455">Buildings</strong></span> | ||
<p data-start="457" data-end="974"><span style="font-family: arial, helvetica, sans-serif; font-size: 12pt;" >The built environment of Venice reflects centuries of architectural evolution, adaptation, and shifting patterns of residential and economic activity. This page provides an overview of how Venetian buildings are classified, how they are used today, and what recent analyses reveal about their structure, height, residential capacity, and vacancy. It incorporates extensive measurements, geospatial analysis, and modeling to improve building-scale understanding across the historic center.</span></p> | <p data-start="457" data-end="974"><span style="font-family: arial, helvetica, sans-serif; font-size: 12pt;">The built environment of Venice reflects centuries of architectural evolution, adaptation, and shifting patterns of residential and economic activity. This page provides an overview of how Venetian buildings are classified, how they are used today, and what recent analyses reveal about their structure, height, residential capacity, and vacancy. It incorporates extensive measurements, geospatial analysis, and modeling to improve building-scale understanding across the historic center.</span></p> | ||
<span style="text-decoration: underline; font-family: arial, helvetica, sans-serif;" ><span style="font-size: 14pt;" ><strong data-start="984" data-end="1022">Building Types & Classification</strong></span></span> | <span style="text-decoration: underline; font-family: arial, helvetica, sans-serif;"><span style="font-size: 14pt;"><strong data-start="984" data-end="1022">Building Types & Classification</strong></span></span> | ||
=== <span style="font-family: arial, helvetica, sans-serif; font-size: 12pt;" ><strong data-start="1028" data-end="1079">Overview of Venetian Classification Systems</strong></span> === | === <span style="font-family: arial, helvetica, sans-serif; font-size: 12pt;"><strong data-start="1028" data-end="1079">Overview of Venetian Classification Systems</strong></span> === | ||
<p data-start="1080" data-end="1433"><span style="font-family: arial, helvetica, sans-serif; font-size: 10pt;" >Venice classifies its buildings through a structured system that identifies architectural typology, construction period, and predominant functional characteristics. This classification helps describe when, how, and for what purpose each building was constructed, enabling a clearer understanding of the city’s urban fabric and its evolution.</span></p> | <p data-start="1080" data-end="1433"><span style="font-family: arial, helvetica, sans-serif; font-size: 10pt;">Venice classifies its buildings through a structured system that identifies architectural typology, construction period, and predominant functional characteristics. This classification helps describe when, how, and for what purpose each building was constructed, enabling a clearer understanding of the city’s urban fabric and its evolution.</span></p> | ||
<span style="font-family: arial, helvetica, sans-serif;"> | <span style="font-family: arial, helvetica, sans-serif;" > | ||
For more details on individual building types, uses, and classification logic, see this page | For more details on individual building types, uses, and classification logic, see this page | ||
(https://wiki.cityknowledge.org/index.php/Building). | (https://wiki.cityknowledge.org/index.php/Building). | ||
| Line 15: | Line 15: | ||
== <span style="font-family: arial, helvetica, sans-serif; font-size: 12pt;" ><strong data-start="1439" data-end="1490">Architectural Typology (Tipologia Edilizia)</strong></span> == | == <span style="font-family: arial, helvetica, sans-serif; font-size: 12pt;" ><strong data-start="1439" data-end="1490">Architectural Typology (Tipologia Edilizia)</strong></span> == | ||
<p data-start="1491" data-end="1936"><span style="font-family: arial, helvetica, sans-serif; font-size: 10pt;" >Architectural typology identifies building form, organization of interior space, and structural hierarchy. Typology categories include long-standing Venetian forms such as monocellular, bicellular, tricellular, polycellular, unitary, modular, and shed structures.</span></p> | <p data-start="1491" data-end="1936"><span style="font-family: arial, helvetica, sans-serif; font-size: 10pt;" >Architectural typology identifies building form, organization of interior space, and structural hierarchy. Typology categories include long-standing Venetian forms such as monocellular, bicellular, tricellular, polycellular, unitary, modular, and shed structures.</span></p> | ||
<span style="font-family: arial, helvetica, sans-serif;" > | <span style="font-family: arial, helvetica, sans-serif;" > | ||
< | <span style="font-family: arial, helvetica, sans-serif;"><span style="font-size: 13.3333px;" >These typologies were essential to our models because different types exhibit distinct relationships among measured height, floor height, and the expected number of floors.</span></span></span>[[File:Fant.png|300px|center|frameless]] | ||
| Line 26: | Line 25: | ||
== <span style="font-family: arial, helvetica, sans-serif;" >'''<span style="font-size: 14pt;" >Building Use Analysis and Spatial Visualization</span>'''</span> == | == <span style="font-family: arial, helvetica, sans-serif;" >'''<span style="font-size: 14pt;" >Building Use Analysis and Spatial Visualization</span>'''</span> == | ||
<span style=" | <span style="font-family: arial, helvetica, sans-serif;" > | ||
<span style="font-size: 10pt;" >Understanding how Venice’s buildings are used—residential, tourist-oriented, mixed-use, or vacant—is essential for analyzing depopulation, housing availability, and long-term urban sustainability. Our analysis combines architectural classifications, building-level fieldwork, and ArcGIS-based spatial modeling to create the first citywide, building-specific visualization of residential, non-residential, and vacant space across Venice. This unified dataset and accompanying maps form the basis for a continuous monitoring system for urban change in the historic city center.</span></span> | |||
=== <span style="font-family: arial, helvetica, sans-serif;" >'''<span style="text-decoration: underline;" ><span style="font-size: 12pt;" ><span>Estimating Residential Units and Building Use</span></span></span>'''</span> === | === <span style="font-family: arial, helvetica, sans-serif;" >'''<span style="text-decoration: underline;" ><span style="font-size: 12pt;" ><span>Estimating Residential Units and Building Use</span></span></span>'''</span> === | ||
<p data-start="2442" data-end="2519"><span style="font-family: arial, helvetica, sans-serif; font-size: 10pt;" >Residential unit estimates were derived using a unit & residential estimation model that merges:</span></p> | <p data-start="2442" data-end="2519"><span style="font-family: arial, helvetica, sans-serif; font-size: 10pt;" >Residential unit estimates were derived using a unit & residential estimation model that merges:</span></p> | ||
<span style="font-family: arial, helvetica, sans-serif;" ></span> | |||
*<p data-start="2523" data-end="2601"><span style="font-family: arial, helvetica, sans-serif; font-size: 10pt;" ><strong data-start="2523" data-end="2543">Water meter data</strong> (number of units per meter, tariff type, and consumption)</span></p> | *<p data-start="2523" data-end="2601"><span style="font-family: arial, helvetica, sans-serif; font-size: 10pt;" ><strong data-start="2523" data-end="2543">Water meter data</strong> (number of units per meter, tariff type, and consumption)</span></p> | ||
*<p data-start="2604" data-end="2675"><span style="font-family: arial, helvetica, sans-serif; font-size: 10pt;" ><strong data-start="2604" data-end="2632">Livable volume estimates</strong> (footprint × estimated residential floors)</span></p> | *<p data-start="2604" data-end="2675"><span style="font-family: arial, helvetica, sans-serif; font-size: 10pt;" ><strong data-start="2604" data-end="2632">Livable volume estimates</strong> (footprint × estimated residential floors)</span></p> | ||
| Line 34: | Line 36: | ||
*<p data-start="2739" data-end="2804"><span style="font-family: arial, helvetica, sans-serif; font-size: 10pt;" ><strong data-start="2739" data-end="2759">Observed proxies</strong>: doorbells, shutter status, ground-floor use</span></p> | *<p data-start="2739" data-end="2804"><span style="font-family: arial, helvetica, sans-serif; font-size: 10pt;" ><strong data-start="2739" data-end="2759">Observed proxies</strong>: doorbells, shutter status, ground-floor use</span></p> | ||
<p data-start="2806" data-end="2856"><span style="font-family: arial, helvetica, sans-serif; font-size: 10pt;" >Water data also allowed us to distinguish between:</span></p> | <p data-start="2806" data-end="2856"><span style="font-family: arial, helvetica, sans-serif; font-size: 10pt;" >Water data also allowed us to distinguish between:</span></p> | ||
<span style="font-family: arial, helvetica, sans-serif;" ></span> | |||
*<p data-start="2860" data-end="2917"><span style="font-family: arial, helvetica, sans-serif; font-size: 10pt;" ><strong data-start="2860" data-end="2882">Primary residences</strong> (residential tariff, active usage)</span></p> | *<p data-start="2860" data-end="2917"><span style="font-family: arial, helvetica, sans-serif; font-size: 10pt;" ><strong data-start="2860" data-end="2882">Primary residences</strong> (residential tariff, active usage)</span></p> | ||
*<p data-start="2920" data-end="2987"><span style="font-family: arial, helvetica, sans-serif; font-size: 10pt;" ><strong data-start="2920" data-end="2951">Secondary residences / STRs</strong> (higher tariff, intermittent usage)</span></p> | *<p data-start="2920" data-end="2987"><span style="font-family: arial, helvetica, sans-serif; font-size: 10pt;" ><strong data-start="2920" data-end="2951">Secondary residences / STRs</strong> (higher tariff, intermittent usage)</span></p> | ||
| Line 40: | Line 44: | ||
==== <span style="font-size: 10pt; font-family: arial, helvetica, sans-serif;" >'''Visualization: Model Accuracy Checks'''</span> ==== | ==== <span style="font-size: 10pt; font-family: arial, helvetica, sans-serif;" >'''Visualization: Model Accuracy Checks'''</span> ==== | ||
<gallery mode="packed" widths="420" heights="260"> | <span style="font-family: arial, helvetica, sans-serif;" ></span><gallery mode="packed" widths="420" heights="260"> | ||
File:4.4.png| | File:4.4.png| | ||
<span style="font-family: arial, helvetica, sans-serif; font-size: 10pt;"> | <span style="font-family: arial, helvetica, sans-serif; font-size: 10pt;"> | ||
| Line 60: | Line 64: | ||
<span style="font-size: 10pt;" ></span></span> | <span style="font-size: 10pt;" ></span></span> | ||
=== <span style="text-decoration: underline; font-family: arial, helvetica, sans-serif;" >'''<span style="font-size: 12pt;" >Mapping Residential vs. Tourist vs. Vacant Space</span>'''</span> === | === <span style="text-decoration: underline; font-family: arial, helvetica, sans-serif;" >'''<span style="font-size: 12pt;" >Mapping Residential vs. Tourist vs. Vacant Space</span>'''</span> === | ||
<span style=" | <span style="font-family: arial, helvetica, sans-serif;" > | ||
<span style="font-size: 10pt;" ><span>The unified building dataset allowed us to classify every building in Venice into residential, mixed, non-residential, STR/hotel, or vacant categories. These classifications enabled the production of several city-scale maps illustrating how building use varies spatially.</span></span></span> | |||
==== <span style="font-family: arial, helvetica, sans-serif; font-size: 10pt;" ><strong data-start="4072" data-end="4105">3D Residential Volume Mapping</strong></span> ==== | ==== <span style="font-family: arial, helvetica, sans-serif; font-size: 10pt;" ><strong data-start="4072" data-end="4105">3D Residential Volume Mapping</strong></span> ==== | ||
<span style=" | <span style="font-family: arial, helvetica, sans-serif;" > | ||
<span style="font-size: 10pt;" >By extruding footprints based on estimated residential floors, we visualized the concentration of long-term housing across islands.</span> | |||
<gallery mode="packed" widths="420" heights="260"> | </span> | ||
<span style="font-family: arial, helvetica, sans-serif;" ></span><gallery mode="packed" widths="420" heights="260"> | |||
File:4.10.png| | File:4.10.png| | ||
| Line 81: | Line 87: | ||
</gallery> | </gallery> | ||
<span style="font-size: 10pt | <span style="font-size: 10pt;" ></span><p data-start="209" data-end="568"><span style="font-family: arial, helvetica, sans-serif; font-size: 10pt;" >Together, the fieldwork and data analysis support Venice’s first building-level model for estimating population, residential units, and vacancy. This system enables the city to identify underused or vacant structures that could be reallocated for long-term housing, and to pinpoint neighborhoods where non-residential or tourist-oriented functions dominate.</span></p> | ||
<p data-start="573" data-end="923"><span style="font-family: arial, helvetica, sans-serif; font-size: 10pt;" >The 3D visualizations below illustrate the distribution of residential and non-residential space within each building. By comparing total building height to the proportion dedicated to residential use (green) versus non-residential use (pink), the model highlights patterns of mixed use, tourist pressure, and areas with limited housing availability.</span></p> | <p data-start="573" data-end="923"><span style="font-family: arial, helvetica, sans-serif; font-size: 10pt;" >The 3D visualizations below illustrate the distribution of residential and non-residential space within each building. By comparing total building height to the proportion dedicated to residential use (green) versus non-residential use (pink), the model highlights patterns of mixed use, tourist pressure, and areas with limited housing availability.</span></p> | ||
<p data-start="573" data-end="923"> | <p data-start="573" data-end="923"> </p> | ||
<p data-start="573" data-end="923"> | <p data-start="573" data-end="923"> </p> | ||
=== <span style="text-decoration: underline; font-size: 12pt; font-family: arial, helvetica, sans-serif;" >'''<span>Tourist & Non-Residential Concentrations</span>'''</span> === | === <span style="text-decoration: underline; font-size: 12pt; font-family: arial, helvetica, sans-serif;" >'''<span>Tourist & Non-Residential Concentrations</span>'''</span> === | ||
<gallery mode="packed" widths="420" heights="260"> | <span style="font-family: arial, helvetica, sans-serif;" ></span><gallery mode="packed" widths="420" heights="260"> | ||
File:4.13.png| | File:4.13.png| | ||
| Line 108: | Line 114: | ||
=== <span style="text-decoration: underline; font-size: 12pt; font-family: arial, helvetica, sans-serif;" >Residential Density and Tourist Pressure</span> === | === <span style="text-decoration: underline; font-size: 12pt; font-family: arial, helvetica, sans-serif;" >Residential Density and Tourist Pressure</span> === | ||
<gallery mode="packed" widths="420" heights="260"> | <span style="font-family: arial, helvetica, sans-serif;" ></span><gallery mode="packed" widths="420" heights="260"> | ||
File:population.png| | File:population.png| | ||
| Line 126: | Line 132: | ||
<span style="font-size: 10pt; font-family: arial, helvetica, sans-serif;" >The figure on the left illustrates the distribution of residential unit density across Venice. In the density deviation map, blue buildings indicate areas with higher-than-average residential density, indicating neighborhoods with more long-term housing. Red buildings indicate lower residential density, highlighting areas where non-residential uses—such as short-term rentals, commercial activity, or tourist functions—are more dominant. </span> | <span style="font-size: 10pt; font-family: arial, helvetica, sans-serif;" >The figure on the left illustrates the distribution of residential unit density across Venice. In the density deviation map, blue buildings indicate areas with higher-than-average residential density, indicating neighborhoods with more long-term housing. Red buildings indicate lower residential density, highlighting areas where non-residential uses—such as short-term rentals, commercial activity, or tourist functions—are more dominant. </span> | ||
<span style="font-family: arial, helvetica, sans-serif;" >'''Figure 3.7: '''</span><br> | <span style="font-family: arial, helvetica, sans-serif;" >'''Figure 3.7: '''</span><br><span style="font-family: arial, helvetica, sans-serif;" > | ||
<span style=" | <span style="font-size: 10pt;" >This map shows the final inhabited buildings layer, which includes every structure in Venice containing at least one residential unit. To create this layer, we used water meter tariff types to distinguish actual residential users from non-residents such as STR operators or second-home owners. We then applied annual water consumption data to identify vacant units, classifying any meter using less than 0.5 cubic meters of water per year as vacant. The resulting map represents all buildings that are actively inhabited and forms the foundation for the subsequent residential unit and population estimation model.</span> | ||
<span style="font-size: 10pt; font-family: arial, helvetica, sans-serif;" > | <span style="font-size: 10pt;" ></span></span> | ||
=== <span style="font-family: arial, helvetica, sans-serif;" ><span style="font-size: 12pt;" >'''<span style="text-decoration: underline;" >Floor Estimation Model and Building Height Validation</span>'''</span><span style="font-size: 12pt;" ><span style="text-decoration: underline;" ></span></span></span> === | |||
<span style="font-size: 12pt;" > | <span style="font-family: arial, helvetica, sans-serif;" > | ||
<span style="font-size: 12pt;" ><span style="text-decoration: underline;" ></span></span> | |||
<span style="font-size: 12pt;" > | </span> | ||
<span style="font-family: arial, helvetica, sans-serif;" ></span><gallery mode="packed" widths="350" heights="350"> | |||
File:4.1.png|<span style="font-family: arial, helvetica, sans-serif; font-size: 10pt;"><strong>Figure 4.1 – Regression Dataset</strong><br> | |||
Dataset showing slope, intercept, and r² values for each architectural type using both GIS-derived and field-measured heights.</span> | |||
File:4.2.png|<span style="font-family: arial, helvetica, sans-serif; font-size: 10pt;"><strong>Figure 4.2 – Floors vs. Measured Height</strong><br> | |||
Measured building heights plotted against observed floors, with regression lines demonstrating strong predictive relationships.</span> | |||
File:4.3.png|<span style="font-family: arial, helvetica, sans-serif; font-size: 10pt;"><strong>Figure 4.3 – Floors vs. Qu_Gronda Height</strong><br> | |||
Same analysis using Qu_Gronda–Qu_Terra values, showing weaker correlations due to missing or invalid GIS height data.</span> | |||
</gallery> | |||
<span style="font-size: 12pt; font-family: arial, helvetica, sans-serif;" ><span style="text-decoration: underline;" ></span></span><p data-start="347" data-end="837"><span style="font-family: arial, helvetica, sans-serif; font-size: 10pt;" >To build a reliable floor-estimation model for every building in Venice, we first analyzed how building height relates to the number of floors across architectural types. The dataset table compiles the slope, intercept, and r² values for each type, comparing height derived from Qu_Gronda–Qu_Terra against our field-measured heights. The consistently higher r² values from the measured dataset indicate that nighttime fieldwork yields more accurate height estimates than the existing GIS fields.</span></p> | |||
<p data-start="839" data-end="1397"><span style="font-family: arial, helvetica, sans-serif; font-size: 10pt;" >Figures 4.2 and 4.3 visualize this relationship. Figure 4.2 uses measured heights and shows strong, consistent correlations—most buildings fall close to their architectural-type regression lines, allowing reliable floor prediction. Figure 4.3, which relies on Qu_Gronda–Qu_Terra data, displays weaker patterns with unrealistic horizontal trendlines due to missing or invalid Qu_Gronda values. These comparisons confirm that measured heights are essential for accurate floor estimation and form the basis for the population modeling used later in the project.</span></p> | |||
<p data-start="839" data-end="1397"> </p> | |||
<p data-start="839" data-end="1397"> </p> | |||
== <span style="font-family: arial, helvetica, sans-serif;" ><span style="font-size: 12pt;" >'''<span style="text-decoration: underline;" >Final Analysis</span>'''</span></span> == | |||
<span style="font-family: arial, helvetica, sans-serif;" > | |||
<span style="font-family: arial, helvetica, sans-serif; font-size: 10pt;" ><span style="font-family: arial, helvetica, sans-serif;" >Together, this workflow demonstrates how combining field measurements, architectural classifications, and utility-based indicators can generate the first building-level population and unit estimation model for Venice. By validating building heights through regression modeling, distinguishing residential, tourist, and vacant units using water-meter data, and visualizing these patterns across the city, the project creates a clearer understanding of Venice’s shifting urban fabric. The resulting maps reveal where long-term residents remain concentrated, where short-term rentals dominate, and where vacancy is silently expanding. This integrated approach not only improves the accuracy of demographic estimation but also provides a replicable analytical framework for future monitoring, planning, and preservation efforts—offering the city actionable insight into its changing residential landscape.</span></span></span><p data-start="839" data-end="1397"> </p> | |||
Latest revision as of 13:55, 11 December 2025
Buildings
The built environment of Venice reflects centuries of architectural evolution, adaptation, and shifting patterns of residential and economic activity. This page provides an overview of how Venetian buildings are classified, how they are used today, and what recent analyses reveal about their structure, height, residential capacity, and vacancy. It incorporates extensive measurements, geospatial analysis, and modeling to improve building-scale understanding across the historic center.
Building Types & Classification
Overview of Venetian Classification Systems
Venice classifies its buildings through a structured system that identifies architectural typology, construction period, and predominant functional characteristics. This classification helps describe when, how, and for what purpose each building was constructed, enabling a clearer understanding of the city’s urban fabric and its evolution.
For more details on individual building types, uses, and classification logic, see this page (https://wiki.cityknowledge.org/index.php/Building). This page provides comprehensive descriptions of Venetian building categories, examples of each type, and further technical documentation that complements the classification system summarized here.
Architectural Typology (Tipologia Edilizia)
Architectural typology identifies building form, organization of interior space, and structural hierarchy. Typology categories include long-standing Venetian forms such as monocellular, bicellular, tricellular, polycellular, unitary, modular, and shed structures.
These typologies were essential to our models because different types exhibit distinct relationships among measured height, floor height, and the expected number of floors.

This map illustrates a block of buildings on the island of FANT, with each building footprint color-coded by its architectural type. The different colors represent variations in construction period, structural form, and intended use, allowing for easy visual comparison of how architectural types are distributed within a single urban block.
Building Use Analysis and Spatial Visualization
Understanding how Venice’s buildings are used—residential, tourist-oriented, mixed-use, or vacant—is essential for analyzing depopulation, housing availability, and long-term urban sustainability. Our analysis combines architectural classifications, building-level fieldwork, and ArcGIS-based spatial modeling to create the first citywide, building-specific visualization of residential, non-residential, and vacant space across Venice. This unified dataset and accompanying maps form the basis for a continuous monitoring system for urban change in the historic city center.
Estimating Residential Units and Building Use
Residential unit estimates were derived using a unit & residential estimation model that merges:
Water meter data (number of units per meter, tariff type, and consumption)
Livable volume estimates (footprint × estimated residential floors)
Census-unit totals (to ensure tract-level consistency)
Observed proxies: doorbells, shutter status, ground-floor use
Water data also allowed us to distinguish between:
Primary residences (residential tariff, active usage)
Secondary residences / STRs (higher tariff, intermittent usage)
Vacant units (≤0.5 m³ annual consumption, validated through shutter data)
Visualization: Model Accuracy Checks


Figure 4.4: This bar chart compares the predicted number of floors from our linear regression model to the actual number of floors observed in the field. The distribution shows that the model performs very accurately: most buildings fall at zero difference, meaning the estimate matches the absolute floor count. Smaller groups appear at ±1 floor, which is expected given variations in building type and parapet height. Only a few buildings deviate by 2–3 floors, indicating that significant errors are rare and limited to atypical structures. Overall, the chart demonstrates that the regression model reliably estimates floors across Venice’s diverse architectural styles.
Figure 4.5: This chart compares two independent proxies for estimating building units: the number of water meters and the number of doorbells recorded in the field. The differences cluster tightly around 0, showing that meter-based unit estimates generally match what is visible on the building exterior. Some buildings deviate slightly in either direction (±1–5 units), reflecting cases where doorbells represent shared entries or meters serve multiple units. A few outliers appear at larger differences, typically in buildings with commercial ground floors or unusual internal layouts. The overall pattern confirms that combining water meter data with observational indicators provides a robust method for estimating residential units.
Mapping Residential vs. Tourist vs. Vacant Space
The unified building dataset allowed us to classify every building in Venice into residential, mixed, non-residential, STR/hotel, or vacant categories. These classifications enabled the production of several city-scale maps illustrating how building use varies spatially.
3D Residential Volume Mapping
By extruding footprints based on estimated residential floors, we visualized the concentration of long-term housing across islands.


Together, the fieldwork and data analysis support Venice’s first building-level model for estimating population, residential units, and vacancy. This system enables the city to identify underused or vacant structures that could be reallocated for long-term housing, and to pinpoint neighborhoods where non-residential or tourist-oriented functions dominate.
The 3D visualizations below illustrate the distribution of residential and non-residential space within each building. By comparing total building height to the proportion dedicated to residential use (green) versus non-residential use (pink), the model highlights patterns of mixed use, tourist pressure, and areas with limited housing availability.
Tourist & Non-Residential Concentrations


The following maps visualize our vacant unit estimation model, highlighting buildings with presumed unoccupied residential space. Each extruded shape represents the portion of a building’s total height that is estimated to be vacant, allowing us to identify where unused residential volume is concentrated across the city. This visualization helps reveal patterns of underutilization and areas where long-term housing capacity may be recoverable.
Residential Density and Tourist Pressure


The figure on the left illustrates the distribution of residential unit density across Venice. In the density deviation map, blue buildings indicate areas with higher-than-average residential density, indicating neighborhoods with more long-term housing. Red buildings indicate lower residential density, highlighting areas where non-residential uses—such as short-term rentals, commercial activity, or tourist functions—are more dominant.
Figure 3.7:
This map shows the final inhabited buildings layer, which includes every structure in Venice containing at least one residential unit. To create this layer, we used water meter tariff types to distinguish actual residential users from non-residents such as STR operators or second-home owners. We then applied annual water consumption data to identify vacant units, classifying any meter using less than 0.5 cubic meters of water per year as vacant. The resulting map represents all buildings that are actively inhabited and forms the foundation for the subsequent residential unit and population estimation model.
Floor Estimation Model and Building Height Validation
-
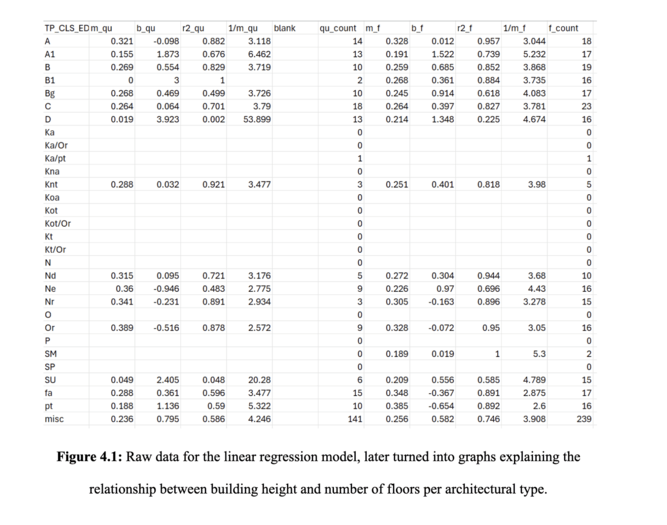 Figure 4.1 – Regression Dataset
 -
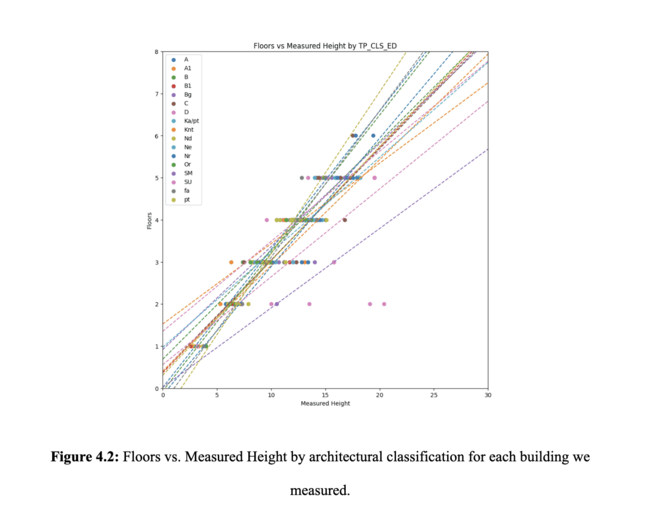 Figure 4.2 – Floors vs. Measured Height
 -
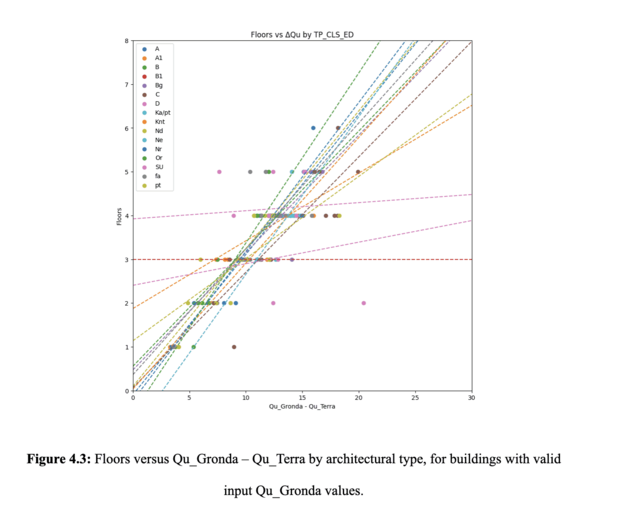 Figure 4.3 – Floors vs. Qu_Gronda Height


To build a reliable floor-estimation model for every building in Venice, we first analyzed how building height relates to the number of floors across architectural types. The dataset table compiles the slope, intercept, and r² values for each type, comparing height derived from Qu_Gronda–Qu_Terra against our field-measured heights. The consistently higher r² values from the measured dataset indicate that nighttime fieldwork yields more accurate height estimates than the existing GIS fields.
Figures 4.2 and 4.3 visualize this relationship. Figure 4.2 uses measured heights and shows strong, consistent correlations—most buildings fall close to their architectural-type regression lines, allowing reliable floor prediction. Figure 4.3, which relies on Qu_Gronda–Qu_Terra data, displays weaker patterns with unrealistic horizontal trendlines due to missing or invalid Qu_Gronda values. These comparisons confirm that measured heights are essential for accurate floor estimation and form the basis for the population modeling used later in the project.
Final Analysis
Together, this workflow demonstrates how combining field measurements, architectural classifications, and utility-based indicators can generate the first building-level population and unit estimation model for Venice. By validating building heights through regression modeling, distinguishing residential, tourist, and vacant units using water-meter data, and visualizing these patterns across the city, the project creates a clearer understanding of Venice’s shifting urban fabric. The resulting maps reveal where long-term residents remain concentrated, where short-term rentals dominate, and where vacancy is silently expanding. This integrated approach not only improves the accuracy of demographic estimation but also provides a replicable analytical framework for future monitoring, planning, and preservation efforts—offering the city actionable insight into its changing residential landscape.