Census 2001: Difference between revisions
Jump to navigation
Jump to search
Algorowara (talk | contribs) No edit summary |
Algorowara (talk | contribs) No edit summary |
||
| Line 1: | Line 1: | ||
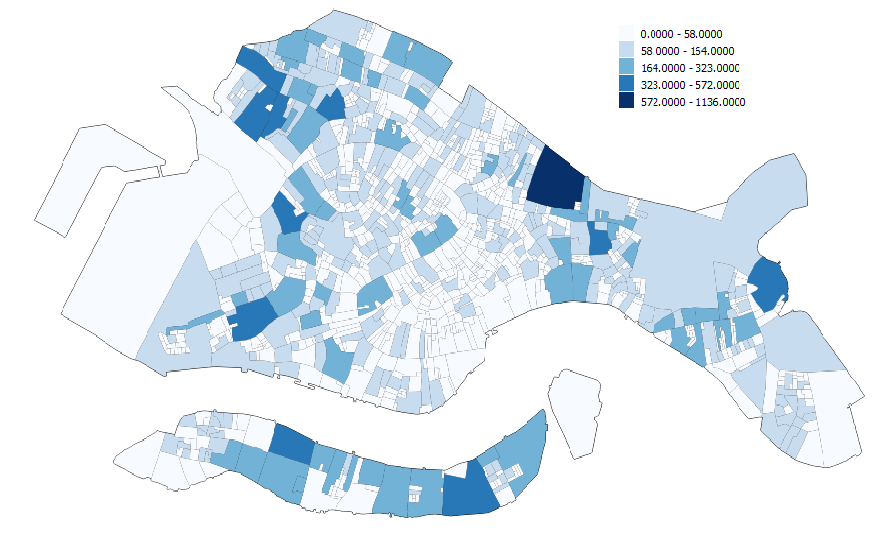
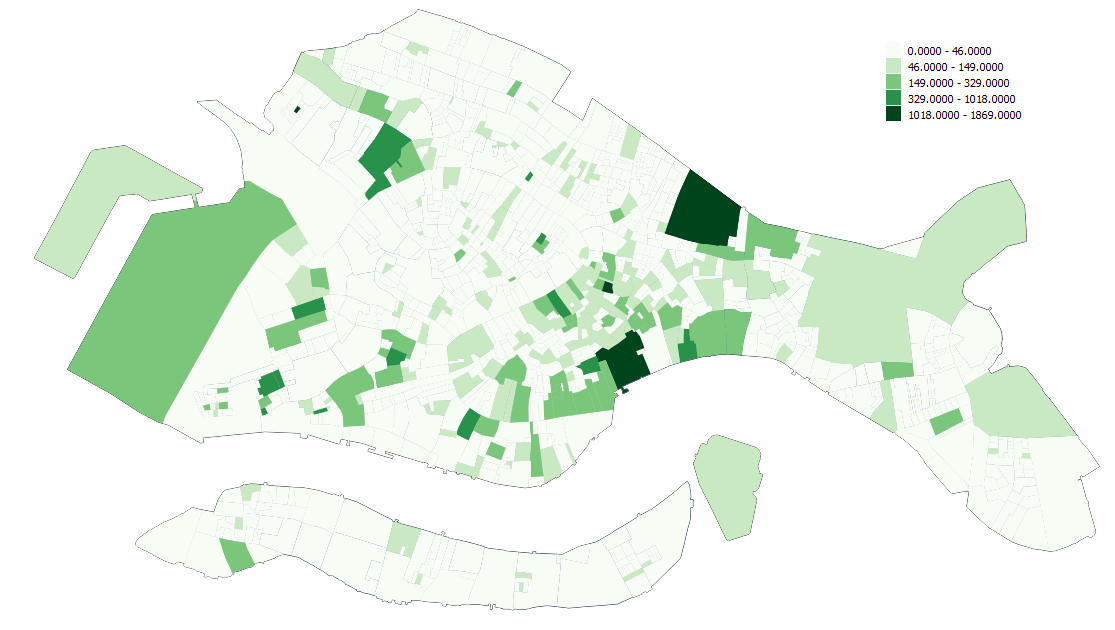
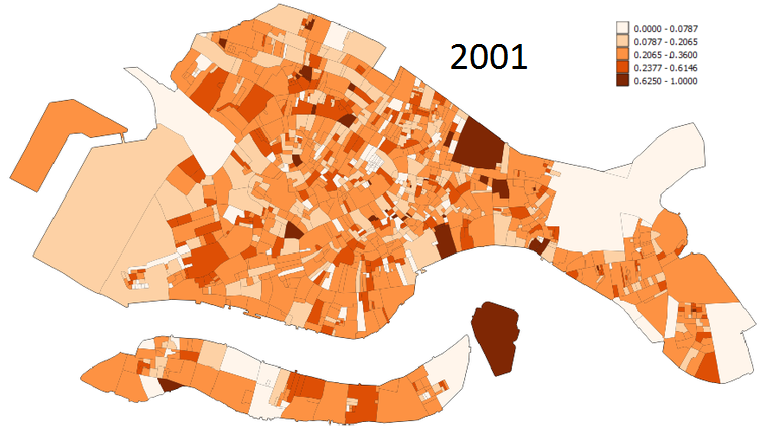
This | This images are graphical representations of the population density of the city of Venice in the year 2001, broken down by [[Census tracts|census tract]], as carried out by the [http://en.istat.it/censimenti/ ISTAT], or Istituto nazionale di statistica (in English: Italian National Institute of Statistics). | ||
==Census by Tract== | ==Census by Tract== | ||
===Population=== | ===Population=== | ||
[[File:Census_2001_Population.PNG|Population]] | [[File:Census_2001_Population.PNG|Population by Census Tract]] | ||
===Working Population=== | ===Working Population=== | ||
[[File:Census_2001_Workers.PNG|Workers by Census Tract]] | |||
===Elderly Population=== | ===Elderly Population=== | ||
[[File:Census_2001_Percent_Elderly.PNG|Percent Elderly by Census Tract]] | |||
==Characteristics of the 2001 Census== | ==Characteristics of the 2001 Census== | ||
Revision as of 00:16, 14 October 2013
This images are graphical representations of the population density of the city of Venice in the year 2001, broken down by census tract, as carried out by the ISTAT, or Istituto nazionale di statistica (in English: Italian National Institute of Statistics).


