Fountains: Difference between revisions
No edit summary |
No edit summary |
||
| Line 43: | Line 43: | ||
| 11 | | 11 | ||
|} | |} | ||
==Analyses== | |||
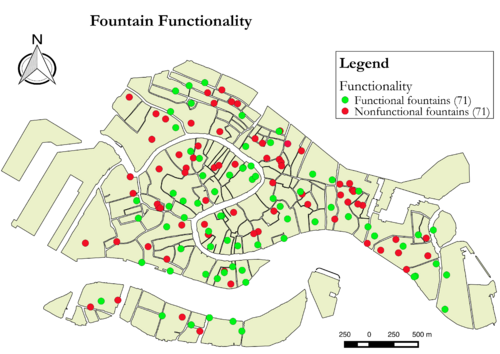
To better visualize this fountain data, below is a map of all functional and non-functional fountains in the City of Venice. There are 71 functional fountains and 71 non-functional fountains that scatter all over the city. | |||
[[File:Fountain Functionality.png|500px |center|thumb|Fountains in Venice]] | |||
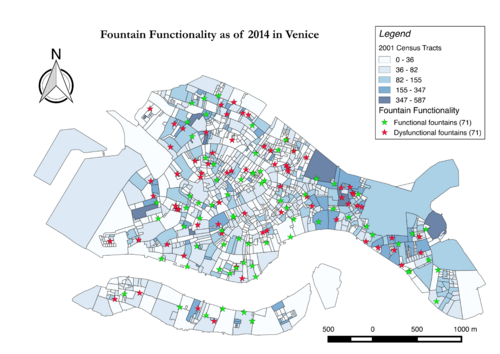
To strengthen the usefulness of this data, the fountain data below is overlaid on top of the 2001 census tracts of the City of Venice. This map gives a profound insight of the public drinking fountains that juxtaposes with the population density. On the map, the lighter the blue color, the lower the population density. The darker the blue color, the higher the population density. By observing this map, there are many non-functional fountains that locate in high population density areas (on the Eastern part of Venice). This data helps prioritize which fountains need to be repaired first. | |||
[[File:Population Density and Fountain Functionality.png|500px |center|thumb|Population density and fountain functionality]] | |||
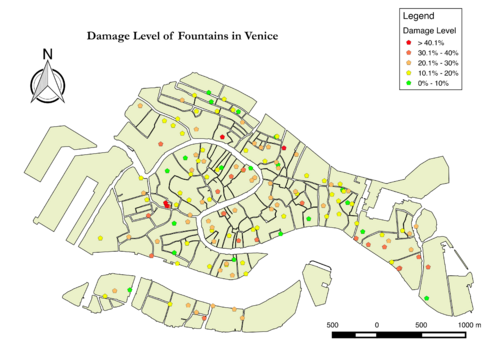
From the fountain data collected in 2014, more up-to-date analysis can be performed such as the one below. The infographic below illustrates the level of damage of each fountain in the Venice. This assessment was achieved by adding the degree of damage by rust (20%), grime (15%), algae (10%), graffiti (15%), missing pieces (25%), and surface damage (15%). | |||
[[File:Fountain Damage Level.png|500px |center|thumb|Fountain damage level]] | |||
==Damage and Preservation== | ==Damage and Preservation== | ||
Revision as of 13:54, 22 December 2014
This page contains the overview of all fountains in Venice .
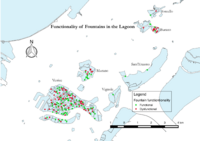 Fountains in the Lagoon assessed in 2014 | |
| Total Number | 181 |
|---|---|
| Total Number Functioning | 89 |
| Purpose | Utility |
Fountains are pieces of functional material culture that provide Venetians with clean drinking water. Typically centrally located within one of the city's many campi, these fountains symbolize the transition of art within the city with some being uniquely hand-crafted and others products of mass production. 181 is not the total number of all fountains in the Venetian Lagoon. There are more fountains out on other islands in the Lagoon that are not assessed yet.
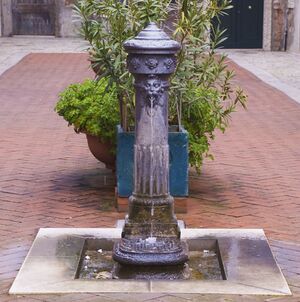
Fountains in Venice
Statistics
Below is a table of all fountains in the City of Venice as of 2014.
| Sestiere | Number of Total Fountains | Number of Functional Fountains |
|---|---|---|
| Cannaregio | 31 | 10 |
| Castello | 35 | 17 |
| San Marco | 18 | 11 |
| Santa Croce | 13 | 4 |
| Dorsoduro | 32 | 18 |
| San Polo | 13 | 11 |
Analyses
To better visualize this fountain data, below is a map of all functional and non-functional fountains in the City of Venice. There are 71 functional fountains and 71 non-functional fountains that scatter all over the city.
To strengthen the usefulness of this data, the fountain data below is overlaid on top of the 2001 census tracts of the City of Venice. This map gives a profound insight of the public drinking fountains that juxtaposes with the population density. On the map, the lighter the blue color, the lower the population density. The darker the blue color, the higher the population density. By observing this map, there are many non-functional fountains that locate in high population density areas (on the Eastern part of Venice). This data helps prioritize which fountains need to be repaired first.
From the fountain data collected in 2014, more up-to-date analysis can be performed such as the one below. The infographic below illustrates the level of damage of each fountain in the Venice. This assessment was achieved by adding the degree of damage by rust (20%), grime (15%), algae (10%), graffiti (15%), missing pieces (25%), and surface damage (15%).
Damage and Preservation
For general information pertaining to the sources of damage to Venetian fountains, please see the Damage to public art page.
For general information pertaining to the restoration and preservation of Venetian fountains, please see the Restoration and preservation of public art page.
Specific information regarding the damage and restoration needs of each fountain can be found on the pages dedicated to each individual fountain, as listed in the map below and in the navigation box under the "See Also" section of this page.
Location
{{#compound_query: |Fountains;?Coordinates;?PV ID;icon=Red Marker.png |Coordinates::+;?Coordinates;?PV ID;icon=Blue Marker.png |limit=500 |height=500px |format=map }}
See Also
| ||||||||||||||||||||
References
- Rizzi, Alberto. "Scultura Esterna a Venezia." Stamperia di Venezia Editrice, 1987.
- Venice Project Center
Bibliography
- 2010 WPI PreserVenice Project Team
- 2008 WPI PreserVenice Project Team
- 2007 WPI PreserVenice Project Team
- 2000 WPI PreserVenice Project Team