Census 1991: Difference between revisions
Algorowara (talk | contribs) No edit summary |
Algorowara (talk | contribs) No edit summary |
||
| Line 2: | Line 2: | ||
==Census by Tract== | ==Census by Tract== | ||
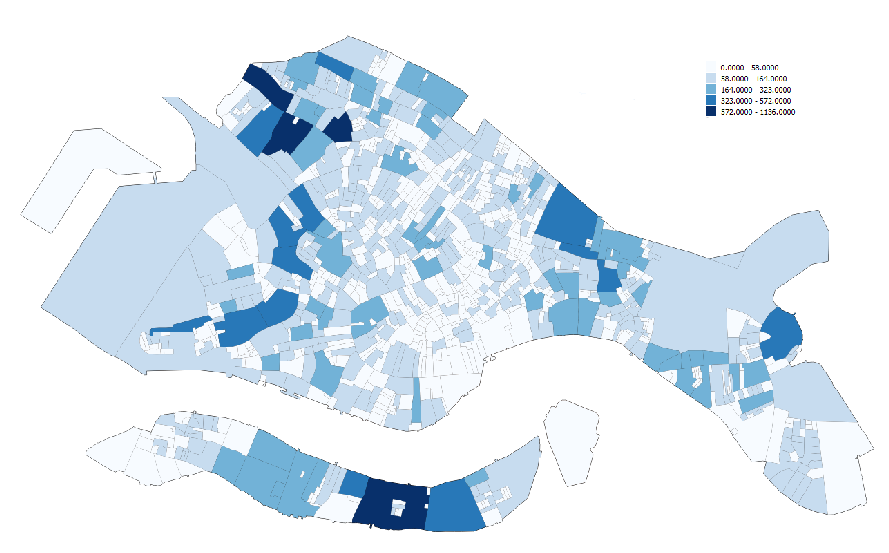
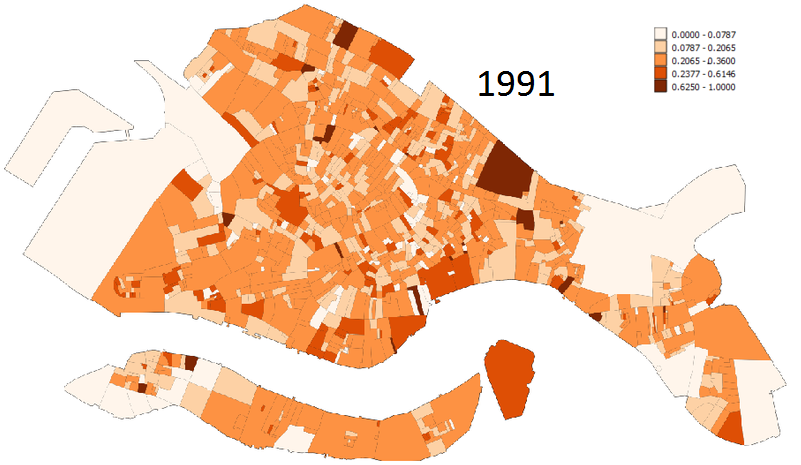
The census is broken down into over one thousand subdivisions, each of which is a distinct geographical area below. Statistics are kept with the census tract at the smallest unit of measure, and as a result, the graphics below show these discrete chunks, coloring each one according to the appropriate statistical range. | |||
===Population=== | |||
[[File:Census_1991_Population.PNG|Population by Census Tract]] | |||
The key here indicates the number of persons living in the given census tract. It is not scaled by area. | |||
===Working Population=== | |||
[[File:Census_1991_Workers.PNG|Workers by Census Tract]] | |||
The key here indicates the number of persons working in the given census tract. It is not scaled by area. | |||
===Elderly Population=== | |||
[[File:Census_1991_Percent_Elderly.PNG|Percent Elderly by Census Tract]] | |||
The key here indicates the proportion of persons living in the given census tract who are elderly (65+ years). | |||
==Characteristics of the 1991 Census== | ==Characteristics of the 1991 Census== | ||
Revision as of 19:33, 16 October 2013
This images are graphical representations of the population density of the city of Venice in the year 1991, broken down by census tract, as carried out by the ISTAT, or Istituto nazionale di statistica (in English: Italian National Institute of Statistics).
Census by Tract
The census is broken down into over one thousand subdivisions, each of which is a distinct geographical area below. Statistics are kept with the census tract at the smallest unit of measure, and as a result, the graphics below show these discrete chunks, coloring each one according to the appropriate statistical range.
Population
The key here indicates the number of persons living in the given census tract. It is not scaled by area.
Working Population
The key here indicates the number of persons working in the given census tract. It is not scaled by area.
Elderly Population
The key here indicates the proportion of persons living in the given census tract who are elderly (65+ years).

