Fountains: Difference between revisions
No edit summary |
No edit summary |
||
| Line 124: | Line 124: | ||
*[http://www.wpi.edu/Pubs/E-project/Available/E-project-122207-150125/ 2007 WPI PreserVenice Project Team] | *[http://www.wpi.edu/Pubs/E-project/Available/E-project-122207-150125/ 2007 WPI PreserVenice Project Team] | ||
*[http://www.wpi.edu/Pubs/E-project/Scanned/00E050I 2000 WPI PreserVenice Project Team] | *[http://www.wpi.edu/Pubs/E-project/Scanned/00E050I 2000 WPI PreserVenice Project Team] | ||
==External Links== | ==External Links== | ||
Revision as of 18:55, 22 December 2014
This page contains the overview of all fountains in Venice .
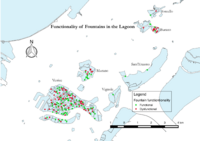 Fountains in the Lagoon assessed in 2014 | |
| Total Number | 181 |
|---|---|
| Total Number Functioning | 89 |
| Purpose | Utility |
Fountains are pieces of functional material culture that provide Venetians with clean drinking water. Typically centrally located within one of the city's many campi, these fountains symbolize the transition of art within the city with some being uniquely hand-crafted and others products of mass production. 181 is not the total number of all fountains in the Venetian Lagoon. There are more fountains out on other islands in the Lagoon that are not assessed yet.
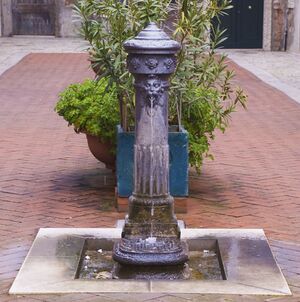
Fountains in Venice
Statistics
Below is a table of all fountains in the City of Venice as of 2014.
| Sestiere | Number of Total Fountains | Number of Functional Fountains |
|---|---|---|
| Cannaregio | 31 | 10 |
| Castello | 35 | 17 |
| San Marco | 18 | 11 |
| Santa Croce | 13 | 4 |
| Dorsoduro | 32 | 18 |
| San Polo | 13 | 11 |
| Total | 142 | 71 |
Analyses
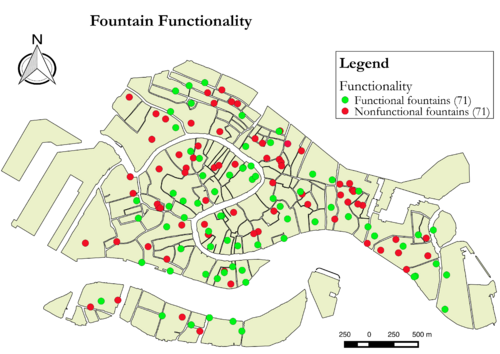
To better visualize this fountain data, below is a map of all functional and non-functional fountains in the City of Venice. There are 71 functional fountains and 71 non-functional fountains that scatter all over the city.
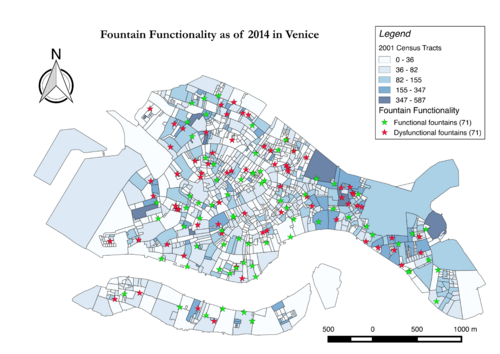
To strengthen the usefulness of this data, the fountain data below is overlaid on top of the 2001 census tracts of the City of Venice. This map gives a profound insight of the public drinking fountains that juxtaposes with the population density. On the map, the lighter the blue color, the lower the population density. The darker the blue color, the higher the population density. By observing this map, there are many non-functional fountains that locate in high population density areas (on the Eastern part of Venice). This data helps prioritize which fountains need to be repaired first.
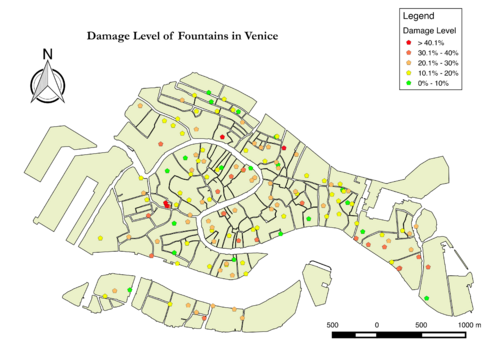
From the fountain data collected in 2014, more up-to-date analysis can be performed such as the one below. The infographic below illustrates the level of damage of each fountain in the Venice. This assessment was achieved by adding the degree of damage by rust (20%), grime (15%), algae (10%), graffiti (15%), missing pieces (25%), and surface damage (15%).
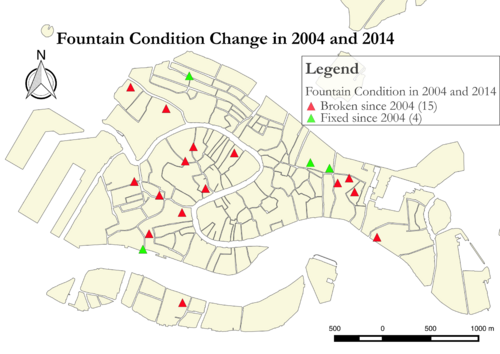
The last infographic below shows the fountain condition change between 2004 and 2014. It is amazing to see that in the course of 10 years, there are 15 fountains get broken and only 4 fountains that get repaired. This is a concern because if left unchecked at this rate, more fountains might get broken and be left to rust. It would be unfortunate to see these public vernacular art pieces get broken and become a part of ancient history.
Fountains on Lagoon islands
Below is a table of fountains on the Lagoon islands as of 2014. There are more fountains on islands such as Lido, Pellestrina and San Francesco that are not yet assessed. Future projects should expand this data and explore more islands including the 3 indicated earlier.
| Island | Number of Total Fountains | Number of Functional Fountains |
|---|---|---|
| Murano | 19 | 10 |
| Burano & Mazzorbo | 15 | 4 |
| Torcello | 2 | 1 |
| Sant'Erasmo | 2 | 2 |
| Vignole | 1 | 1 |
| Total | 39 | 18 |
Analyses
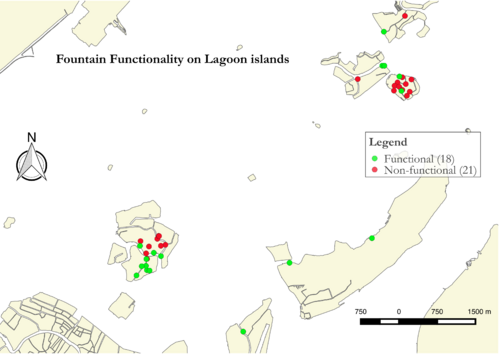
The infographic below shows the 18 functional fountains (green dots) and 21 non-functional fountains (red dots) on islands Murano, Burano and Mazzorbo, Torcello, Sant'Erasmo, and Vignole. Murano and Burano have the same problem because the majority of the fountains there are not working on such populous islands. Some fountains on these islands such as Burano were removed because they no longer work.
Water Waste Analysis in Venice
The infographic below illustrates the average water flow rate of the fountains in the City with the census tracts.
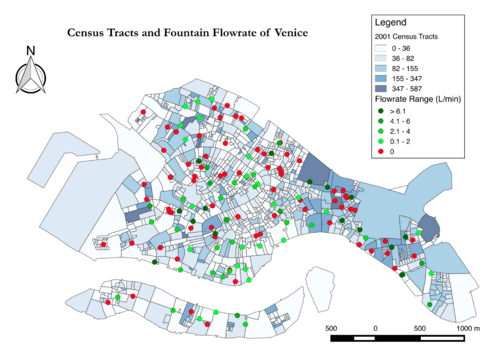
The vast majority of the fountains in the City of Venice run continuously and only a very few of them have a push button to operate. However, for the purpose of this analysis, let's assume that all of the fountains in Venice run continuously just to make the calculations easier. With this assumption, the research team calculated that the City of Venice wastes water about 141,000,000L/year. This is equivalent to the water consumption of about 1000 Italians every year. With this amount of water wastes every year, the City wastes about €141,000 annually. Instead of wasting water and money every year, the City can use it to incorporate a push button on these fountains so that no more water and money will be wasted. Additionally, this money can be used to repaired the broken fountains as well.
Damage and Preservation
For general information pertaining to the sources of damage to Venetian fountains, please see the Damage to public art page.
For general information pertaining to the restoration and preservation of Venetian fountains, please see the Restoration and preservation of public art page.
Location
{{#compound_query: |Fountains;?Coordinates;?PV ID;icon=Red Marker.png |Coordinates::+;?Coordinates;?PV ID;icon=Blue Marker.png |limit=500 |height=500px |format=map }}
Other
See Also
| ||||||||||||||||||||
References
- Rizzi, Alberto. "Scultura Esterna a Venezia." Stamperia di Venezia Editrice, 1987.
- Venice Project Center
Bibliography
- 2010 WPI PreserVenice Project Team
- 2008 WPI PreserVenice Project Team
- 2007 WPI PreserVenice Project Team
- 2000 WPI PreserVenice Project Team