Census Trends
As part of the Venice Project Center, we are interested in tracking trends in the population of Venice to better discern the demographic dynamics of the city, and how we and others are affecting them. Thankfully, the Istituto nazionale di statistica (ISTAT) conducts a census every ten years, allowing us to compare data gathered at consistent intervals using a time-tested and well-funded methodology.
Scope of Census
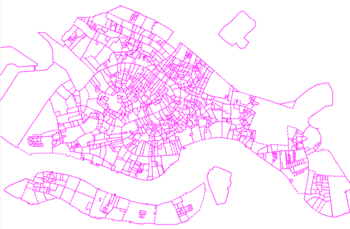
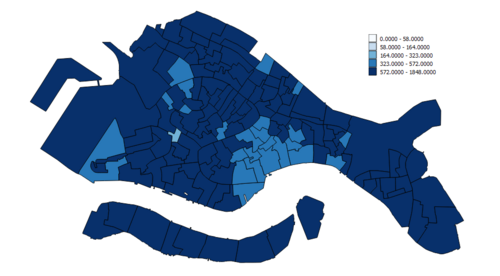
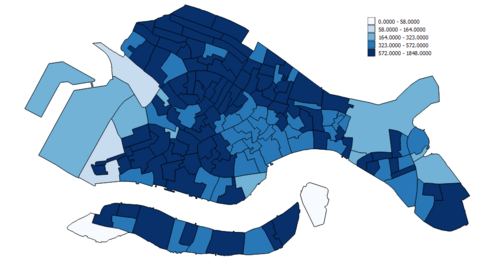
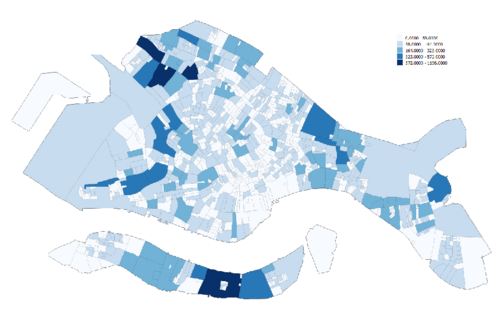
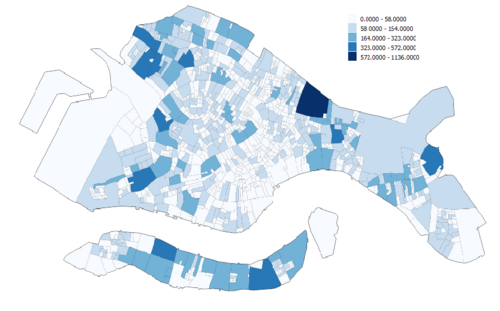
So far the Venice Project Center has organized pages on data from the years 1971, 1981, 1991, and 2001. These data have a minimum resolution unit called a census tract, which is a semi-arbitrary subdivision - it is generally of a certain size, and does not cross the borders of any island, but it is not by definition (though it may be by choice or coincidence) a reflection of an actual physically or culturally distinct area.
Caveat
Since census tracts are not constant in size, shape, or number from year to year, direct comparisons between similarly positioned census tracts in different years can be deceiving. It would be more wise to evaluate an entire census holistically, and compare entire censuses to each other in search of a pattern. Additionally, even census tracts in the same year, being non-uniform in size, should not be directly compared unless either a) the tracts are of similar size, shape, and position, or b) the quantity being evaluated is not size-dependent (such as a proportion rather than a count).
Characteristics of Census Trends
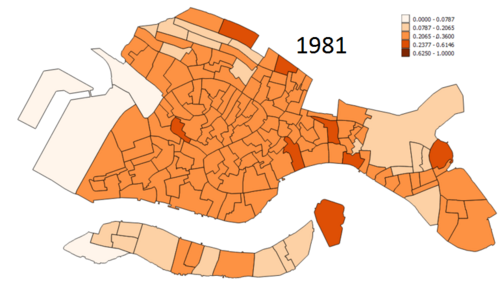
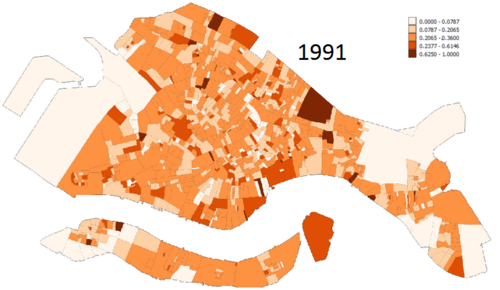
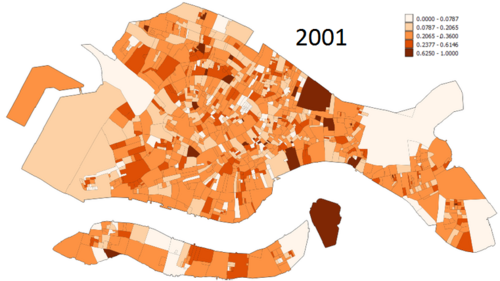
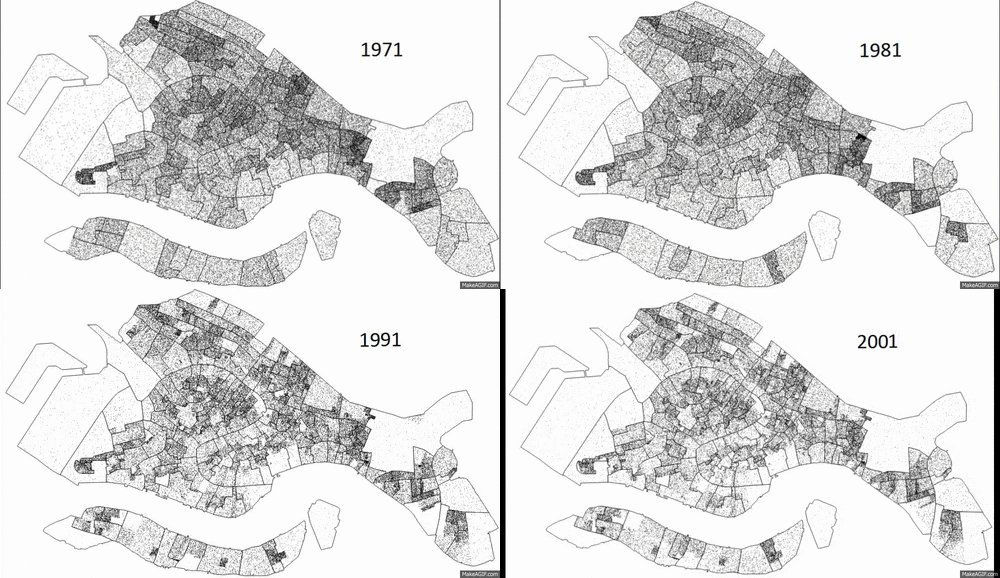
Overall, the population of Venice has been declining for over half a century. Additionally, the census seems to indicate that its population is growing older, which is consistent with a declining number of young people choosing to start a life in Venice, leaving the elderly behind.
Both of these trends seem to be connected to the Piazza San Marco. It was one of the first areas to drop in population, and appears to be the most sparsely populated now. Similarly, the elderly population of Venice seems to have started to grow there, as far back as 1971 and spreading outward even as far as Giudecca. This apparent connection between the two trends seems to support the theory that the departure of the young is behind the dropping population in Venice: as the general population leaves, the elderly are left behind to become an increasingly large fraction of the remaining residents.
    |
Dynamic Maps
 |
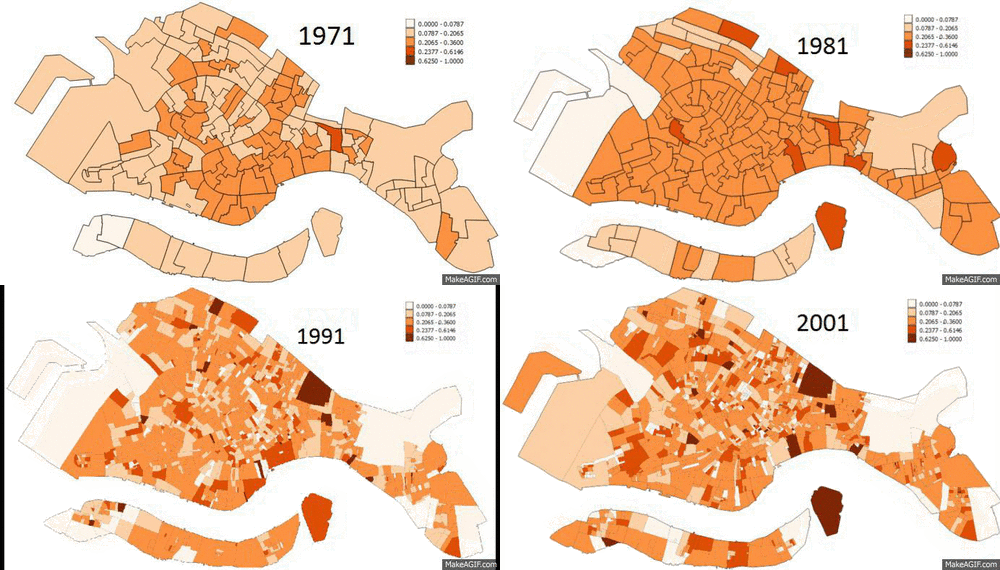 |
To differently represent the changing population of the city over time, the images here display a sequence of maps, each from a different decade of the census. The map to the left displays a dot map, with each resident of the city represented by a dot somewhere in their census tract. Because the census tract is the smallest unit of precision we have available, the placement of an individual within their census tract is random, so it does not reflect differences in population density within a census tract. The map to the right shows the percent of the population who are sixty-five years of age or more.
See Also
External Links
Bibliography
- Italy. Istituto nazionale di statistica. "ISTAT". 1971.
- Italy. Istituto nazionale di statistica. "ISTAT". 1981.
- Italy. Istituto nazionale di statistica. "ISTAT". 1991.
- Italy. Istituto nazionale di statistica. "ISTAT". 2001.

