Census 1971
This images are graphical representations of the population density of the city of Venice in the year 1971, broken down by census tract, as carried out by the ISTAT, or Istituto nazionale di statistica (in English: Italian National Institute of Statistics).
Census by Tract
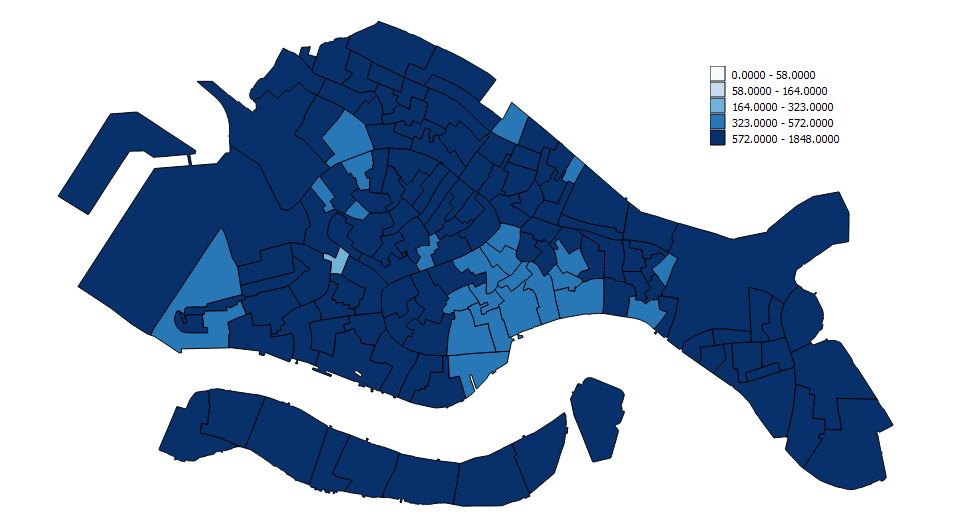
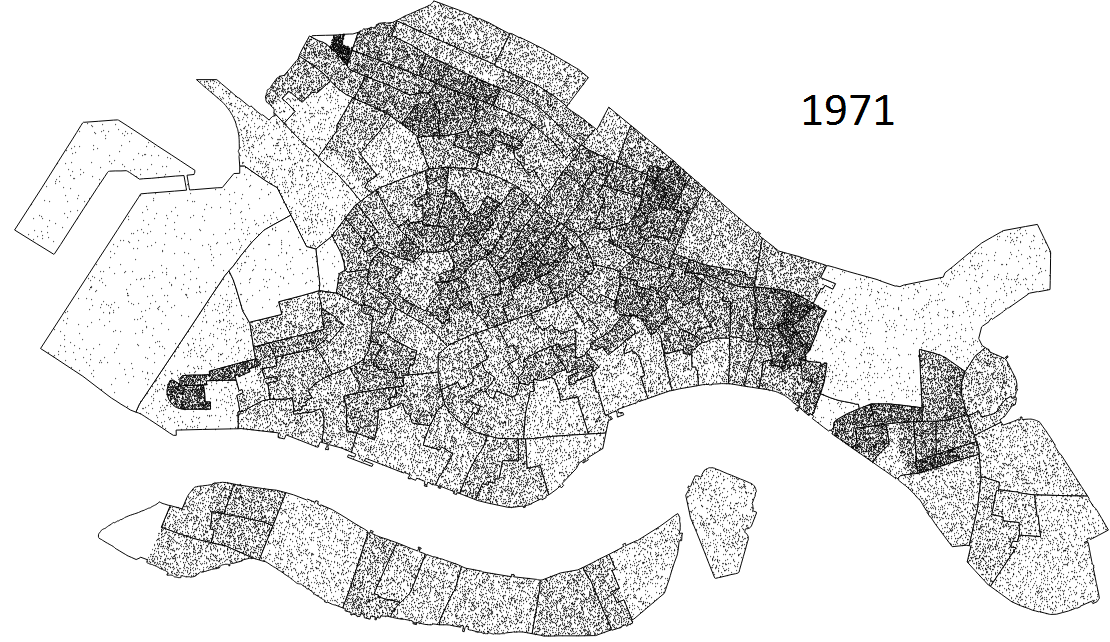
The census is broken down into over one thousand subdivisions, each of which is a distinct geographical area below. Statistics are kept with the census tract at the smallest unit of measure, and as a result, the graphics below show these discrete chunks, coloring each one according to the appropriate statistical range.
Population
The key here indicates the number of persons living in the given census tract. It is not scaled by area.
The dot map shown above displays one dot for every resident, placed randomly within the census tract of their dwelling.
Elderly Population
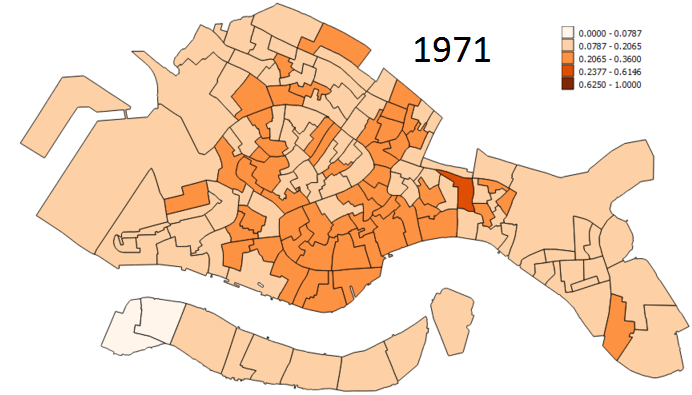
The key here indicates the proportion of persons living in the given census tract who are elderly (65+ years).
Characteristics of the 1971 Census
The 1971 Census shows a relatively young and healthy city, still fairly packed with residents.
Population
Each census tract seems to be very similar to its neighbors, with no sharp borders resulting in dramatic population differences in geographically similar areas. While the Piazza San Marco has fewer residents than the surrounding areas, the drop-off does not appear terribly sharp. The best adjective for the city in this regard seems to be "well-populated".
Elderly Population
The elderly population, while smaller as a proportion of the total compared to later years, is clustered around the center of the city, with a couple of outlying districts with a proportion of elderly persons significantly higher than their neighbors.


