Line 2
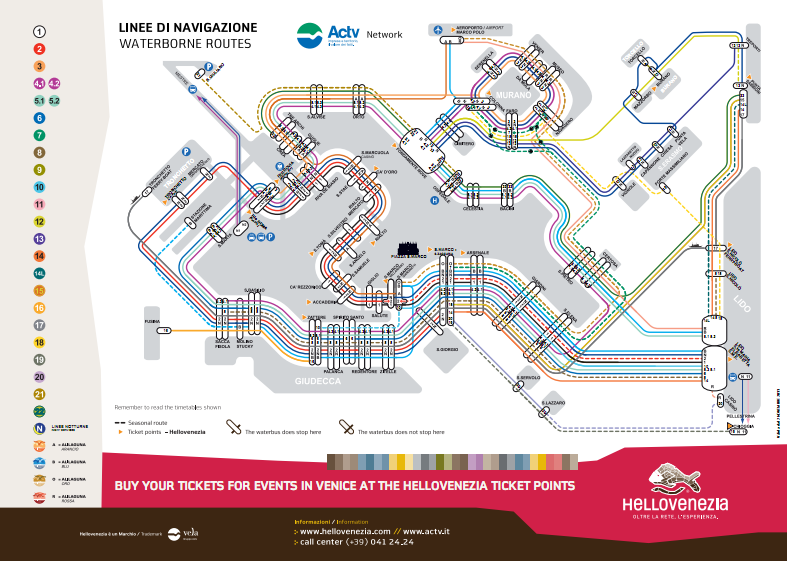
This is information for Line 2 of the Actv public boat transportation company.
Line 2 Stops
There are 17 stops in Line 2:
- San Marco (Zaccaria)
- San Giorgio
- Zitelle
- Redentore
- Palanca
- Zattere
- San Basilio
- Sacca Fisola
- Tronchetto
- Piazzale Roma
- Ferrovia
- San Marcuola
- Rialto
- San Toma
- San Samuele
- Accademia
- San Marco (Giardinetti)
Line 2 Hours of Operation
Line 2 operates from 4:59 AM until 12:24 AM. Click here for an updated schedule.
WPI 2012 Venice IQP Findings for the Impact of Tourism on Line 2
The number of tourists visiting the city of Venice every year has rapidly been increasing, verging on unsustainability, especially during the summer months. The public transportation network has become more congested. This project investigated the impacts of tourism on the public transportation system by collecting ridership data from the popular boat stops and comparing the counts to the number of cruise ships present for each day. The project concluded that cruise ship passengers increased public boat use by a factor of 2 at the least, and a factor of 4 at the most.
Ridership Results
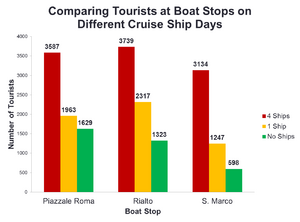


The team collected data from the Piazzale Roma, Rialto, and San Marco boat stops for three days each: one with 4 cruise ships, one with 1 cruise ship, and one with no cruise ships, to compare the amount of tourists that are using the public transportation system.
The team compared the amount of tourists that embark and disembark the boat stops on the different cruise ship days in order to determine how many more tourists are using the boat transportation system on days with 4 ships compared to days with no ships. The data that was collected was also from 9-11 AM and 3-5 PM.
On days with no cruise ships, Piazzale Roma had 1,629 tourists pass through, Rialto had 1,323 tourists, and San Marco had 598 tourists. On days with one ship, Piazzale Roma rose to 1,963 tourists, which is an increase of 20.5% people. Similarly, Rialto’s count rose 75.1% to 2317 tourists, and San Marco’s number increased 108.5% to 1247 tourists.
On days with 4 cruise ships, the increase was even greater. The traffic at Piazzale Roma increased 120.2% to 3587 tourists, compared to the no cruise ship day and the Rialto tourist traffic increased 182.6% to 3,739. Lastly, San Marco saw a sizable increase in the number of tourists, rising to 3,134 which was in increase of 424.1% compared to the day with no cruise ships. A figure displaying this data can be shown in Figure 4-4.
Since the group was able to accurately distinguish between tourists and Venetians, we were able to determine not only how many people were at each stop, but what percentage of that total were tourists and Venetians. By comparing these numbers over the different cruise ship days, the team was able to see how much the ratio between tourists and Venetians changed at the different boat stops.
At Piazzale Roma on a non-cruise ship day, the ratio between the two is almost even, with 47% tourists and 52% Venetians. However, as the number of cruise ships increase, so does the percentage of tourists, so on a four cruise ship day, the tourists outnumber the number of Venetians by 6:1. This data is displayed in Figure 4-5.
A similar trend occurred at San Marco, where the non-cruise ship day contained around a 50/50 split of Venetians and tourists, and the four cruise ship day consisted of 82% tourists and only 18% Venetians. Data showing this is displayed in Figure 4-6.
Lastly, the data from the Rialto stop was slightly different, with much more Venetians using the boat network at Line 2 than tourists. On the day with one cruise ship, the percentages of Venetians versus tourists were almost identical, with 49% tourists and 51% Venetians, as shown in Figure 4-7. Lastly, on the four cruise ship day, the boat transportation system was overwhelmed with over ¾ of all of the passengers being tourists, and only 1/4 being Venetians.
Impact of Cruise Ships on ACTV Line 2
To analyze the impact of tourists on the ACTV boat network, the team was able to look at how much the tourists changed the overall percentage of people using the boat transportation system on Line 2, as well as the total number of tourists using each boat stop. Lastly, all of the tourism data was compiled by boat stop, and maximums, minimums, and averages were calculated to show how many extra people are found at these boat stops over the three different cruise ship days.
Tourists Affecting Line 2 at Observed Boat Stops

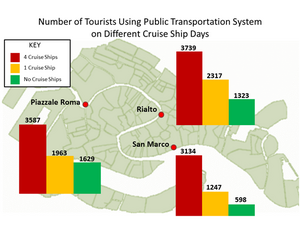
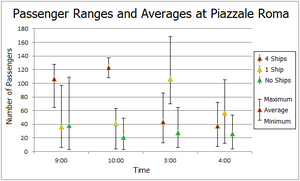
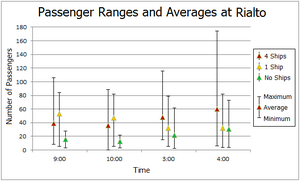
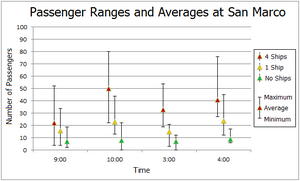
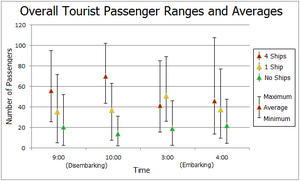
First, the group wanted to determine the overall percentage of Venetians versus tourists on the different cruise ship days, so the total numbers for each were analyzed and the data is shown below in Figure 5-1. All of these data were collected during the hours of 9-11 AM and 3-5 PM.
From the figure, on the non-cruise ship days, there were more Venetians overall compared the tourists, which is due to the low amount of tourists in general during the early winter months. With the addition of just one cruise ship in port, the amount of tourists increased to 56%. Since the maximum capacity of the one cruise ship days was 3,780 passengers, it only took less than 4,000 passengers throughout the City to affect the overall population at all three boat stops. Lastly, with four cruise ships in the Port of Venice, the overall tourist counts jumped to 82%, which is a 44% increase in the total population of people using the Line 2 ACTV boats. This massive increase extremely affects the public transportation system, all within a day throughout the entire city.
The team then decided to analyze the number of tourists using the public transportation system at the three different boat stops, Piazzale Roma, Rialto, and San Marco, on different cruise ship days. The group determined that overall, on days with 4 cruise ships, there was a dramatic increase in tourists using Line 2 of the public transportation system all over the City. Just at Rialto, the amount of tourists nearly tripled from the non-cruise ship day to the high cruise ship day. At Piazzale Roma, the tourists more than doubled between the two days, and finally at San Marco, the total amount of tourists multiplied by 5. The total number of tourists using the public transportation system at the three boat stops on different cruise ship days can be seen in Figure 5-2.
This large influx of people greatly impacts the boat transportation network and as a result, sometimes crowds the vaporetti so much that multiple boats need to be sent to accommodate all of the people, which occurred multiple times at Rialto on the high cruise ship days.
Analysis of the Flow of Tourism Throughout the City
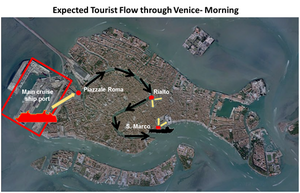
All of the days that were picked to count had cruise ships arrive around 9:00AM and leave around 5:00PM. Because of this, the group observed that the tourists had a distinct travel pattern. For example, in the morning, when the cruise passengers leave the ship, their main priority is usually to visit the iconic sites of that particular city. In order to get to these sites, people generally use public transportation because it is inexpensive and quick. Since Piazzale Roma is the closest boat stop to the cruise ship ports, it is ideal for tourists to choose to enter the public transportation system here. Then, they would likely travel down the Grand Canal to the Rialto stop, which is next to the Rialto Bridge, and the San Marco Stop, located next to Saint Mark’s Square. This flow of tourism is depicted in Figure 5-3.
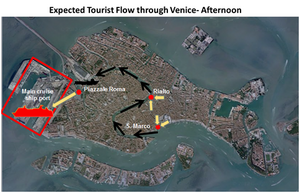
Similarly, in the afternoon, tourists need to get back to the cruise ship port in order to board their ship in time for its departure. To get back to the cruise ship port, the tourists, who are still enjoying the legendary sites, decide to use the transportation system from where they are, Rialto and San Marco, and travel back up the Grand Canal until they reach Piazzale Roma and then disembark. This flow of tourists is shown in Figure 5-4.
To prove that this tourist flow was actually occurring, the group calculated ranges and averages of tourists for all of the days at each stop. At Piazzale Roma, these numbers represent the tourists embarking in the morning and disembarking in the afternoon. The group observed that many more tourists board the boats at this stop in the morning, most likely due to the arrival of cruise ships or other methods of entry to the City. In contrast, more tourists disembark from the boats in the afternoon. This pattern is expected because of the departure of cruise ships, so tourists who need to return to the ships must begin to make their way back to Piazzale Roma in order to get to the ship port on time for their departure. Therefore, the graph shown in Figure 5-5 only represents tourists embarking in the morning, and disembarking in the afternoon at Piazzale Roma.
An opposing pattern occurred at the Rialto boat stop, with more tourists disembarking in the morning, and embarking in the afternoon. This trend is also based on the arrivals and departures of cruise ships. In the morning, tourists coming from cruise ships may utilize the public transportation system in order to reach other destinations, and in the afternoon, they must embark back on the ACTV boats to return to their ships. The following figure depicts the ranges and averages of tourists disembarking in the morning, and embarking in the afternoon at the Rialto boat stop.
The San Marco boat stop saw the same pattern of tourist movement as the Rialto boat stop, and its graph of ranges and averages of tourist passengers on Line 2 is below in Figure 5-7.
The general trend of these graphs is that the ranges and average number of tourists per boat per hour will increase on days when there are cruise ships visiting Venice. The combined ranges and averages are shown in Figure 5-8.
This graph shows that on days with 1 cruise ship in Venice, the total average number of tourists using Line 2 at Piazzale Roma, Rialto, and San Marco increases, along with the minimum and maximum number of tourists. When there are 4 cruise ships, the total average, minimum, and maximum number of tourists using Line 2 at these three stops increases even more, with the exception of the hour between 3:00 PM and 4:00 PM.
All Actv Lines
See Also
External Links
All raw data can be viewed here https://docs.google.com/folder/d/0B9kJ1wT04N5yc0RKSnpEaVktXzg/edit
| |||||||||||||||||||||||||||||
| |||||||||||||||||